|
APPENDIX
A
|
||||||||||||||||||||||||||||||||||||||||||||||||||
|
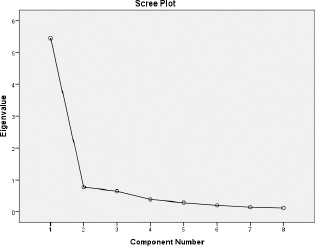
The principal component analysis (PCA) was conducted to examine if components can be created by taking together tests that measure the same physical aspects. The first step in the principal component analysis is to create a correlation matrix between the eight tests. Correlation coefficients should not be above 0.90 between tests (Field 2005). In the current study all correlation coefficients between tests were below .90. The second step is to investigate the communalities which should be higher than 0.4. All communalities were above 0.84, and thus above the required 0.40. The third step is to decide how many components should be extracted. Two criteria were used to decide how many components were retained for extraction and rotation. The first criterion was that components with high eigenvalues (>1.0) according to Kaiser’s criterion were extracted. Secondly, the scree plot was used to produce a plot of each component’s eigenvalue and was analyzed by looking at one or more break points in the data, this is a point where the curve begins to level. With almost 200 participants the scree plot gives a reliable criterion for the analysis. Based on these two criteria the number of components was identified. The PCA showed that with eigenvalues above 1.0, one component can be extracted. The scree plot of the PCA is shown in Figure 1. In Figure 1, two break points are observed at component number two and four. When looking at the theory, four components are more logical than one or two components and therefore four components were extracted. The fourth step is rotating these components by the Varimax rotation. Items with loadings above 0.4 were considered to load on a given component. After all these steps the The KMO test and Bartlett's Test of Sphericity were analyzed. Level of significance was five percent. In Table 4 the rotated component matrix is shown with only components loadings above 0.4. Based on its content component 1 was named “upper body power”, component 2 was named “lower body power”, component 3 was named “speed”, and component 4 was named “agility”. With these four components a total of 90.63% of the variance was explained. The KMO test had a value of 0.884 and this is a very good value according to Field (2005). Bartlett's Test of Sphericity was significant (Approx. Chi2 2683.927, df 28, p < 0.001). Concluding, the PCA combined eight physical tests into four components. These components were also mentioned by Kovacs (2006).
Table 4. Rotated component matrix from PCA.
|
||||||||||||||||||||||||||||||||||||||||||||||||||