|
|
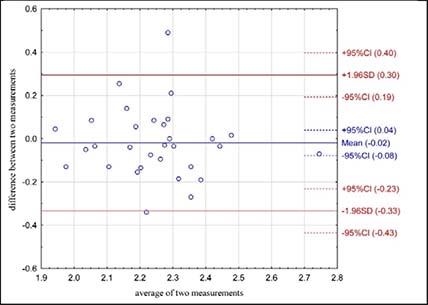
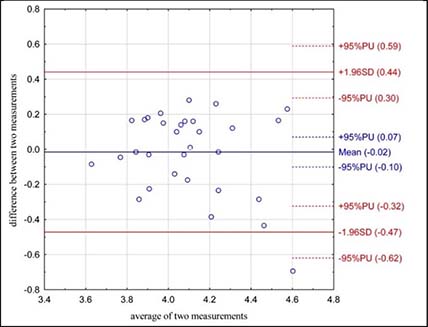
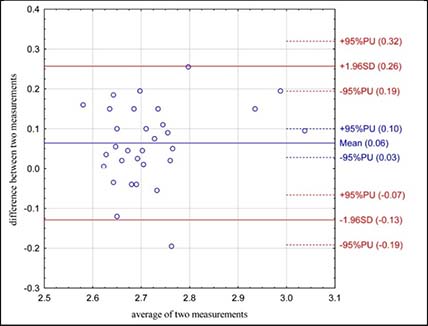
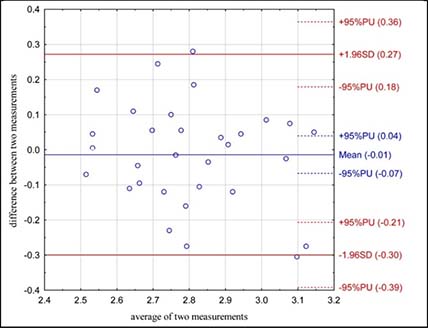
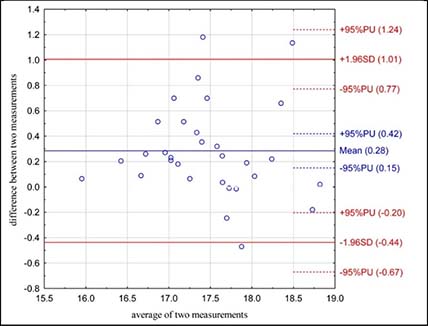
| Figure S1.
Bland–Altman plot illustrating agreement between two repeated measurements
for T1: Ground Pass to Target – time (s). The plot shows the mean
difference (bias) and 95% limits of agreement. |
| |
|
|
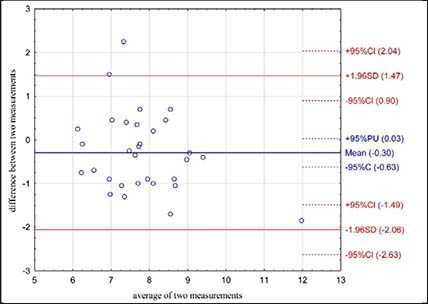
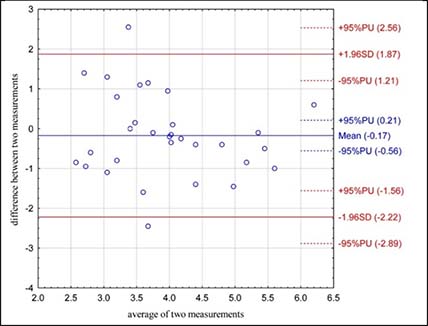
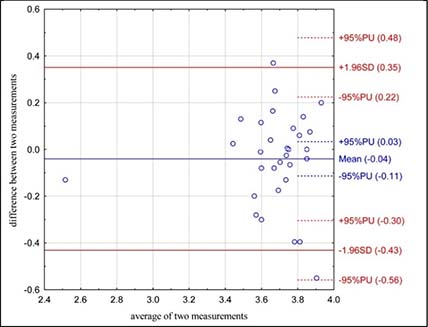
| Figure S2.
Bland–Altman plot illustrating agreement between two repeated measurements
for T1: Ground Pass to Target – accuracy of hits (pts). The plot
shows the mean difference (bias) and 95% limits of agreement. |
| |
|
|
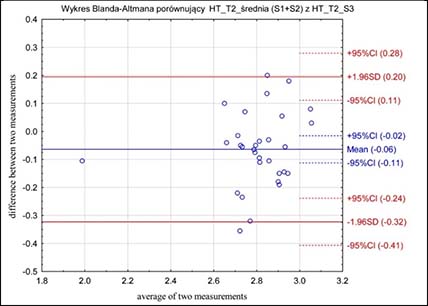
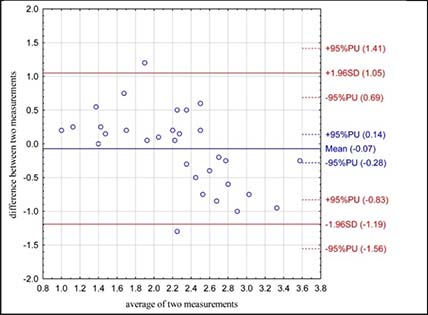
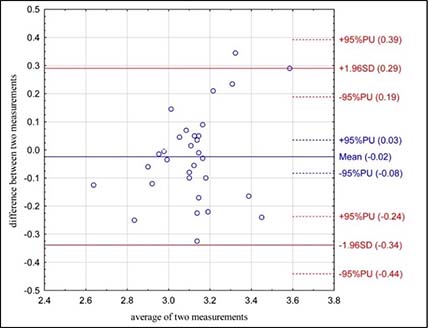
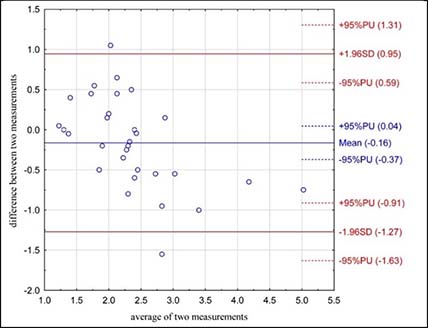
| Figure S3.
Bland–Altman plot illustrating agreement between two repeated measurements
for T2: Ground Pass to Moving Target – time (s). The plot shows
the mean difference (bias) and 95% limits of agreement. |
| |
|
|
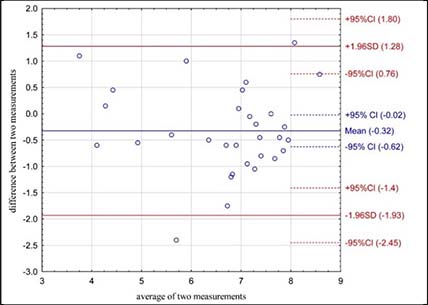
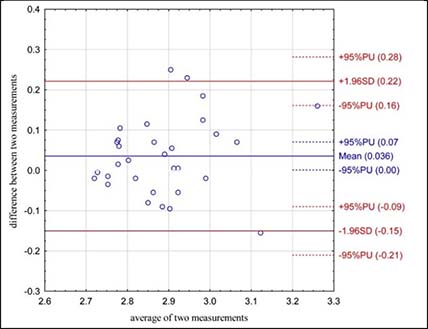
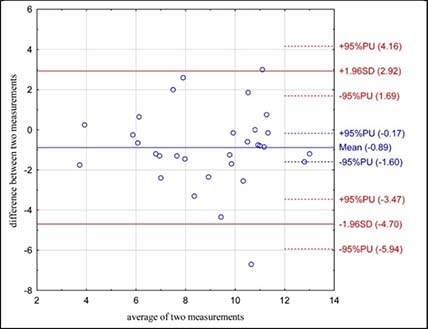
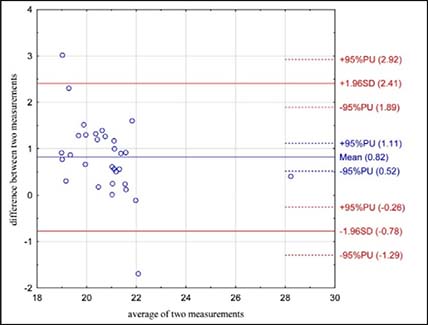
| Figure S4.
Bland–Altman plot illustrating agreement between two repeated measurements
for T2: Ground Pass to Moving Target – accuracy of hits (pts).
The plot shows the mean difference (bias) and 95% limits of agreement. |
| |
|
|
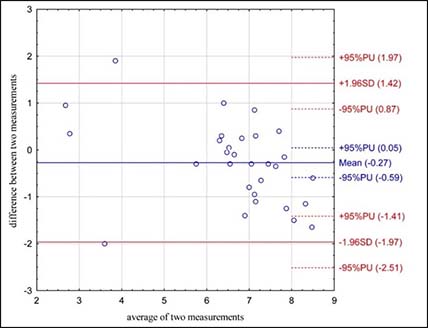
| Figure S5.
Bland–Altman plot illustrating agreement between two repeated measurements
for T3: Power Shot on Goal – time (s). The plot shows the mean
difference (bias) and 95% limits of agreement. |
| |
|
|
| Figure S6.
Bland–Altman plot illustrating agreement between two repeated measurements
for T3: Power Shot on Goal – accuracy of hits (pts). The plot shows
the mean difference (bias) and 95% limits of agreement. |
| |
|
|
| Figure S7.
Bland–Altman plot illustrating agreement between two repeated measurements
for T4: Precision Shooting – time (s) The plot shows the mean difference
(bias) and 95% limits of agreement. |
| |
|
|
| Figure S8.
Bland–Altman plot illustrating agreement between two repeated measurements
for T4: Precision Shooting – accuracy of hits (pts). The plot shows
the mean difference (bias) and 95% limits of agreement. |
| |
|
|
| Figure S9.
Bland–Altman plot illustrating agreement between two repeated measurements
for T5: First Touch and Pass to Moving Target – time (s). The plot
shows the mean difference (bias) and 95% limits of agreement. |
| |
|
|
| Figure S10.
Bland–Altman plot illustrating agreement between two repeated measurements
for T5: First Touch and Pass to Moving Target – accuracy of hits
(pts). The plot shows the mean difference (bias) and 95% limits of agreement. |
| |
|
|
| Figure S11.
Bland–Altman plot illustrating agreement between two repeated measurements
for T6: Cognitive Passing to the Target – time (s). The plot shows
the mean difference (bias) and 95% limits of agreement. |
| |
|
|
| Figure S12.
Bland–Altman plot illustrating agreement between two repeated measurements
for T6: Cognitive Passing to the Target – accuracy of hits (pts).
The plot shows the mean difference (bias) and 95% limits of agreement. |
| |
|
|
| Figure S13.
Bland–Altman plot illustrating agreement between two repeated measurements
for T7: Cognitive Passing to the Moving Target – time (s). The
plot shows the mean difference (bias) and 95% limits of agreement. |
| |
|
|
| Figure S14.
Bland–Altman plot illustrating agreement between two repeated measurements
for T8: Cognitive Passing to the Overload – time (s). The plot
shows the mean difference (bias) and 95% limits of agreement. |
| |
|
|
| Figure S15.
Bland–Altman plot illustrating agreement between two repeated measurements
for T8: Cognitive Passing to the Overload – accuracy of hits (pts).
The plot shows the mean difference (bias) and 95% limits of agreement. |
| |
|
|
| Figure S16.
Bland–Altman plot illustrating agreement between two repeated measurements
for T9: Agility Test with Ball – time (s). The plot shows the mean
difference (bias) and 95% limits of agreement. |
| |
|
|
| Figure S17.
Bland–Altman plot illustrating agreement between two repeated measurements
for T10: Agility Test– time (s). The plot shows the mean difference
(bias) and 95% limits of agreement. |