|
APPENDIX D Meta-Analysis Results (Figure 1 to Figure 12) |
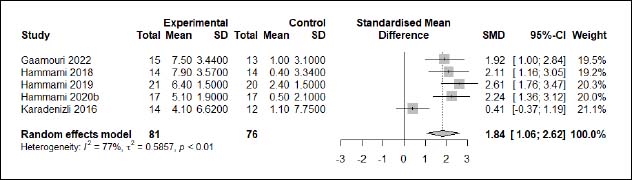 |
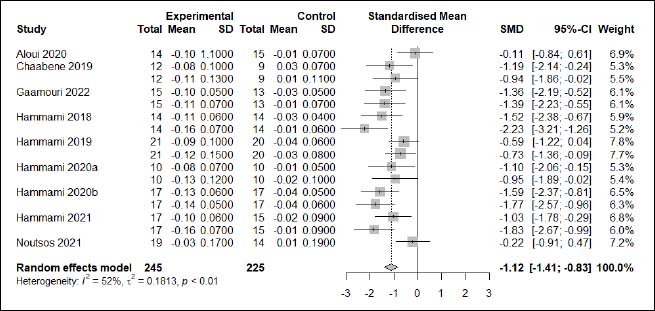
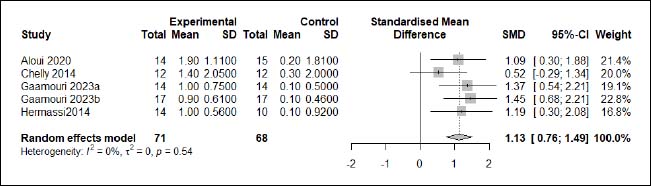
| Appendix D (Figure 1). Forest plot of changes in countermovement jump with arms height in handball players participating in plyometric jump training compared to handball players allocated as controls. Values shown are effect sizes (Hedges’s g) with 95% confidence intervals (CI). The size of the plotted squares reflects the statistical weight of each study. |
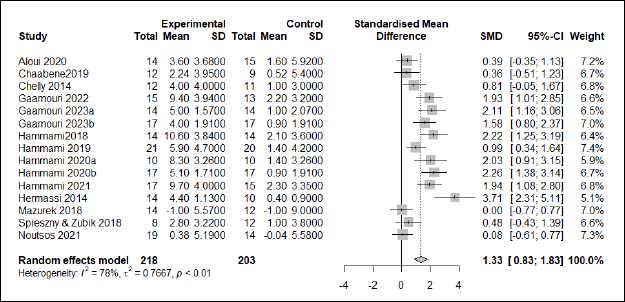 |
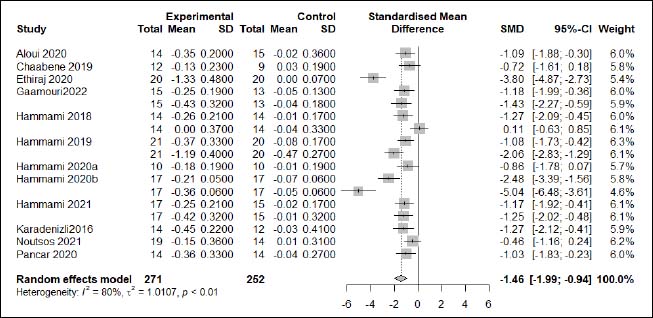
| Appendix D (Figure 2). Forest plot of changes in countermovement jump height in handball players participating in plyometric jump training compared to handball players allocated as controls. Values shown are effect sizes (Hedges’s g) with 95% confidence intervals (CI). The size of the plotted squares reflects the statistical weight of each study. |
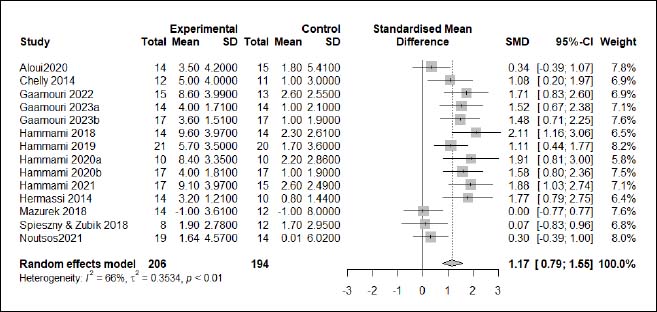 |
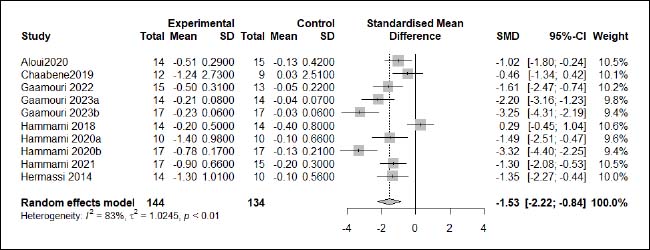
| Appendix D (Figure 3). Forest plot of changes in squat jump height in handball players participating in plyometric jump training compared to handball players allocated as controls. Values shown are effect sizes (Hedges’s g) with 95% confidence intervals (CI). The size of the plotted squares reflects the statistical weight of each study. |
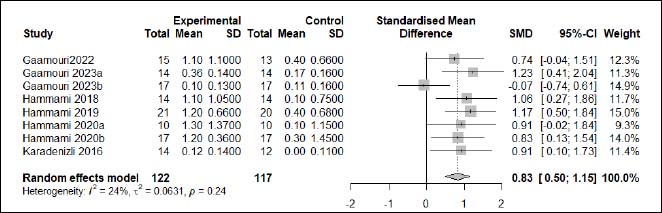 |
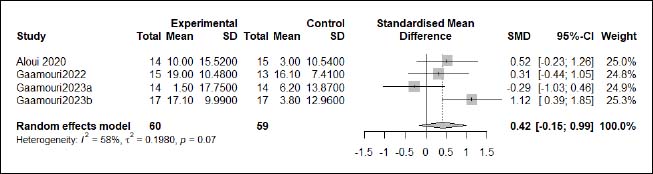
| Appendix D (Figure 4). Forest plot of changes in horizontal jump distance in handball players participating in plyometric jump training compared to handball players allocated as controls. Values shown are effect sizes (Hedges’s g) with 95% confidence intervals (CI). The size of the plotted squares reflects the statistical weight of each study. |
 |
| Appendix D (Figure 5). Forest plot of changes in ≤ 10-m linear sprint time in handball players participating in plyometric jump training compared to handball players allocated as controls. Values shown are effect sizes (Hedges’s g) with 95% confidence intervals (CI). The size of the plotted squares reflects the statistical weight of each study. |
 |
| Appendix D (Figure 6). Forest plot of changes in > 10-m linear sprint time in handball players participating in plyometric jump training compared to handball players allocated as controls. Values shown are effect sizes (Hedges’s g) with 95% confidence intervals (CI). The size of the plotted squares reflects the statistical weight of each study. |
 |
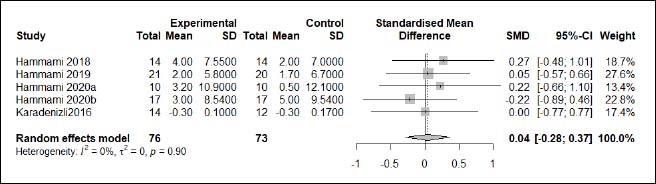
| Appendix D (Figure 7). Forest plot of changes in repeated sprint ability with change-of-direction time in handball players participating in plyometric jump training compared to handball players allocated as controls. Values shown are effect sizes (Hedges’s g) with 95% confidence intervals (CI). The size of the plotted squares reflects the statistical weight of each study. |
 |
| Appendix D (Figure 8). Forest plot of changes in maximal strength in handball players participating in plyometric jump training compared to handball players allocated as controls. Values shown are effect sizes (Hedges’s g) with 95% confidence intervals (CI). The size of the plotted squares reflects the statistical weight of each study. |
 |
| Appendix D (Figure 9). Forest plot of changes in force–velocity in handball players participating in plyometric jump training compared to handball players allocated as controls. Values shown are effect sizes (Hedges’s g) with 95% confidence intervals (CI). The size of the plotted squares reflects the statistical weight of each study. |
 |
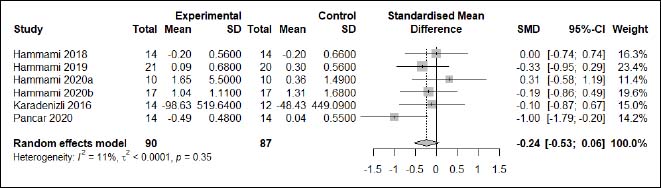
| Appendix D (Figure 10). Forest plot of changes in dynamic balance in handball players participating in plyometric jump training compared to handball players allocated as controls. Values shown are effect sizes (Hedges’s g) with 95% confidence intervals (CI). The size of the plotted squares reflects the statistical weight of each study. |
 |
| Appendix D (Figure 11). Forest plot of changes in static balance in handball players participating in plyometric jump training compared to handball players allocated as controls. Values shown are effect sizes (Hedges’s g) with 95% confidence intervals (CI). The size of the plotted squares reflects the statistical weight of each study. |
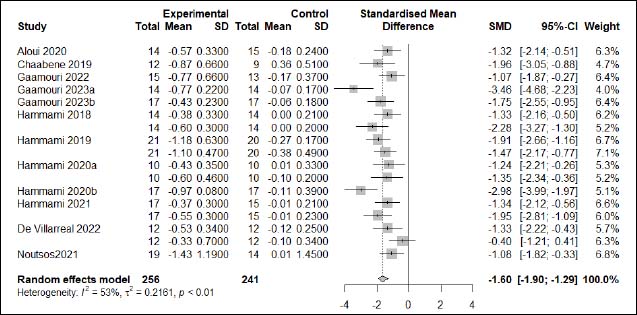 |
| Appendix D (Figure 12). Forest plot of changes in Agility test time in handball players participating in plyometric jump training compared to handball players allocated as controls. Values shown are effect sizes (Hedges’s g) with 95% confidence intervals (CI). The size of the plotted squares reflects the statistical weight of each study. |