|
APPENDIX B-Funnel plot |
|
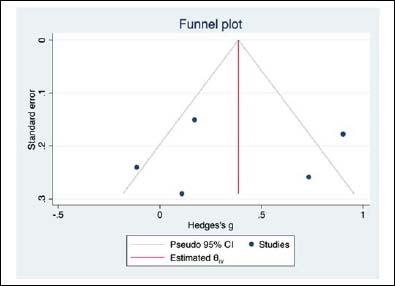
Figure
B1. Funnel plot of publication bias risk of body perception and
global self-worth
(Egger’s test: p= 0.7113 Begg’s test: p=1.000). |
|
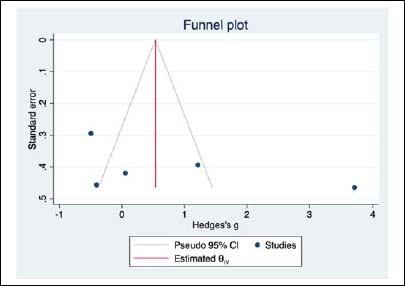
Figure
B2. Funnel plot of publication bias risk of perception of motor
ability and sensory
(Egger’s test: p= 0.3161, Begg’s test: p= 0.4624). |
|
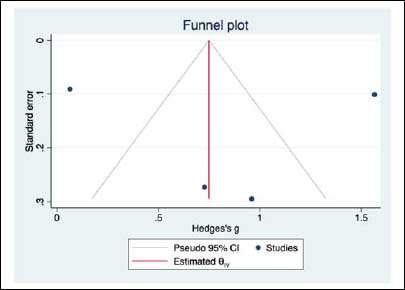
Figure
B3. Funnel plot of publication bias risk of visual perception and
executive function
(Egger’s test: p=0.9180 Begg’s test: p= 0.7341). |