 |
Figure 1.
Changes in urine volumes produced (top) and total body water (bottom) over time during GIH (square) and WIH (circle).
|
|
|
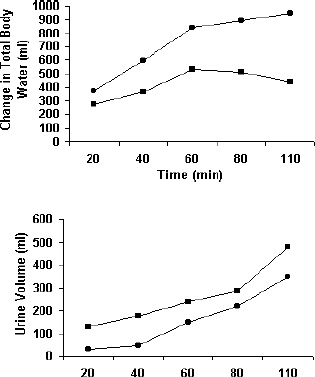
Figure 1.
Changes in urine volumes produced (top) and total body water (bottom) over time during GIH (square) and WIH (circle).
|