 |
Figure 1.
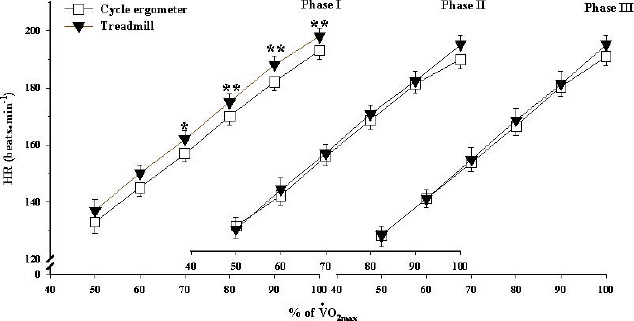
Mean heart rate plotted against fixed percentages of VO for the cycle ergometer (â–¡) and treadmill (â–¼) tests performed in Phase I (left), Phase II (middle) and Phase III (right). * p ≤ 0.05, ** p ≤ 0.01.
|
|
|
Figure 1.
Mean heart rate plotted against fixed percentages of VO for the cycle ergometer (â–¡) and treadmill (â–¼) tests performed in Phase I (left), Phase II (middle) and Phase III (right). * p ≤ 0.05, ** p ≤ 0.01.
|