 |
Figure 1.
Power output response across repeated tests for the control group. Values are Mean (SD) combining the three 30 s sprints in each condition.
|
|
|
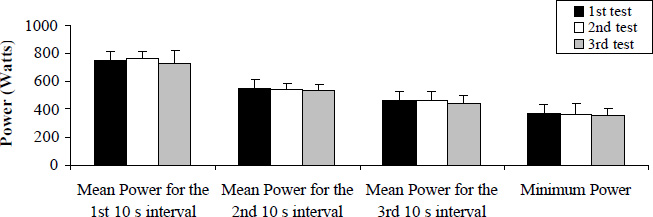
Figure 1.
Power output response across repeated tests for the control group. Values are Mean (SD) combining the three 30 s sprints in each condition.
|