 |
Figure 6.
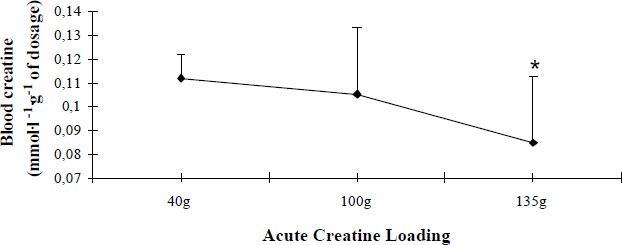
Blood creatine concentration in relation to different creatine dosages. Values are Mean (SD). *significantly different from 40g and 100g Acute Creatine Loading; p<0.05.
|
|
|
Figure 6.
Blood creatine concentration in relation to different creatine dosages. Values are Mean (SD). *significantly different from 40g and 100g Acute Creatine Loading; p<0.05.
|