 |
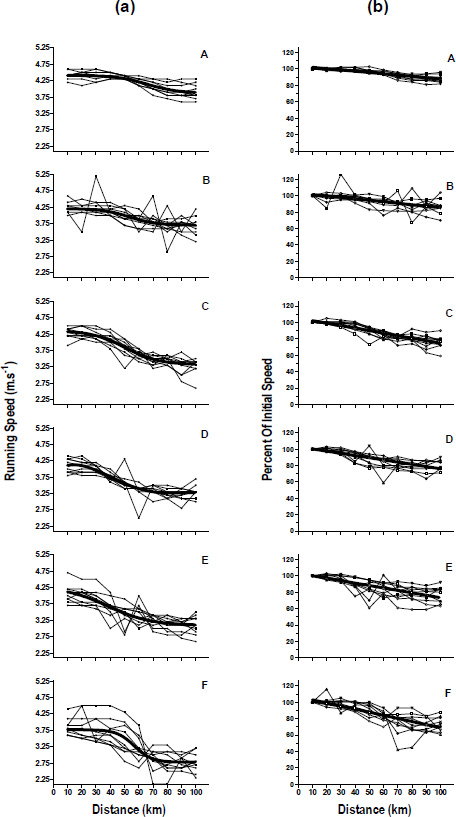
Figure 1.
Mean running speed of runners from the 1995 IAU World Challenge (Groups A-F; n = 10 in each group). The line of best fit for each group mean is shown in bold. Normalized running speed of runners from the 1995 IAU World Challenge (Groups A-F; n = 10 in each group). The line of best fit for each group mean is shown in bold.