 |
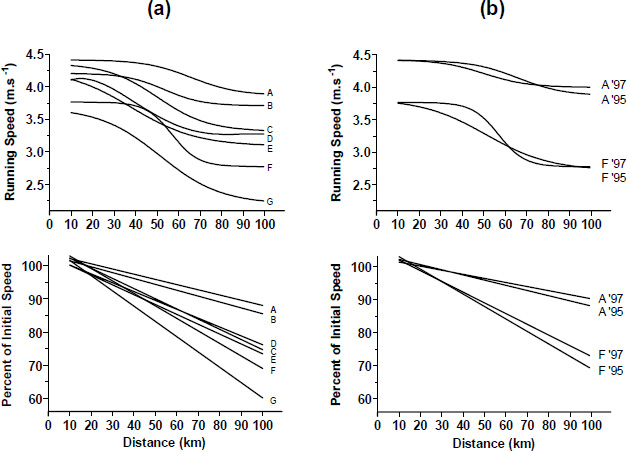
Figure 2.
Top: Lines of best fit for each group (1995) of running speed vs. distance. Bottom: Lines of best fit for each group (1995) of normalized running speed vs. distance. n = 10, groups A-F; n = 7, group G. Top: Lines of best fit of running speed vs. distance for groups A and F (1995) and groups A and F (1997). Bottom: Lines of best fit of normalized running speed vs. distance for groups A and F (1995) and groups A and F (1997). n = 10 in all groups.