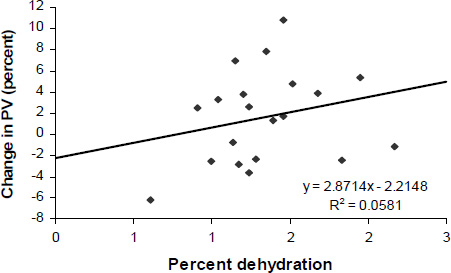
Figure 3.
The regression plot for percent dehydration vs. change in plasma volume.