 |
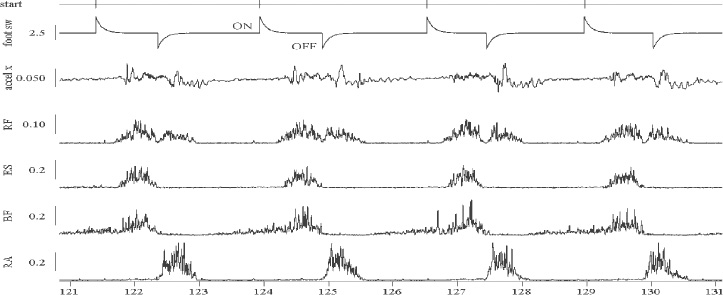
Figure 1.
Example of data obtained for a sequence of rowing stroke obtained from one participant rowing on a Concept 2C during the 2 minute test (pace: 1.47min.sec·500m, 24 stroke·min). Top channel is the event trigger marker obtained from peak detection of footswitch recording (2 channel) to indicate the start of the rowing cycle. The footswitch transients are shown in the second channel, with upward deflections indicating start of drive phase and downward deflections indicating beginning of recovery phase. Successive upward deflections are used to determine duration of rowing cycle. The 3 channel shows the handle x-axis accelerometry record used to measure the onset of the stroke in the cycle. The other channels show sEMG activity as rms Amplitude from m. Rectus Femoris (RF), m. Erector Spinae (ES), m. Biceps Femoris (BF), and m. Rectus Abdominis (RA) respectively. X- axis scale is seconds. Y-axis scales show mV of sEMG for each muscle, and accelerometry and footswitch in Volts.