 |
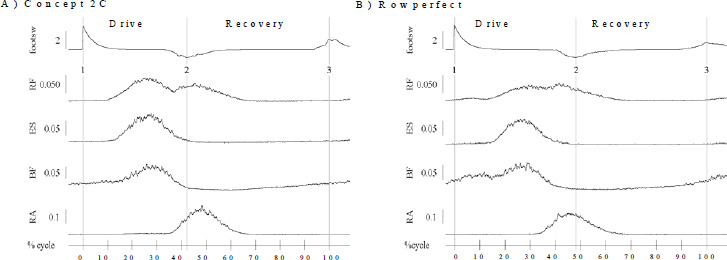
Figure 2.
Example of ensemble average muscle sEMG profiles normalised in time as % of rowing cycle for a participant rowing on: A) Concept 2C at 1.47min.sec·500m, 24 strokes·min (n=39 strokes) and B) Rowperfect 1.47min.sec·500m, 24 strokes·min(n=40 strokes). Top channel is average footswitch trace (calibration bar is 2 V). Vertical cursors indicate duration of drive (1 to 2) and recovery phases (2 to 3) of rowing cycle. The calibration bars for each muscle are in mV and are matched for the two ergometers.