 |
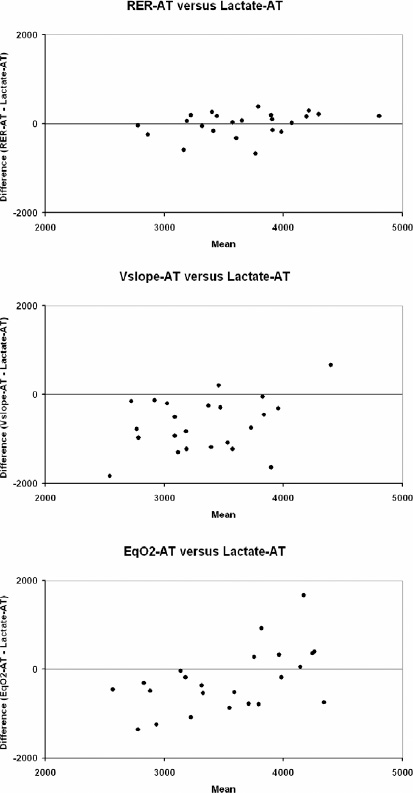
Figure 2.
Altman-Bland plots showing difference between anaerobic threshold detected by the RER-AT, Vslope-AT and EqO-AT method versus blood lactate detected AT (Lactate-AT). Both exercise modes are included in the plots. Values in VOO ml·min