 |
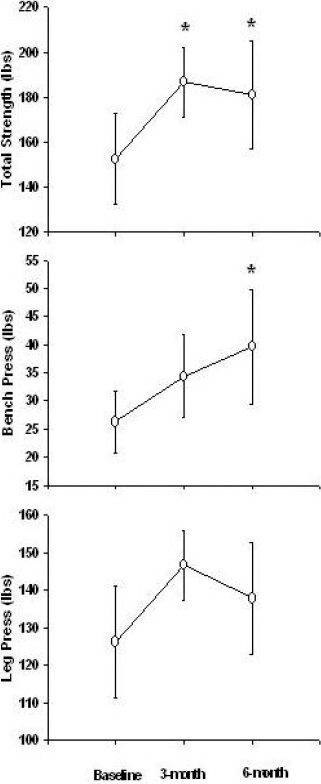
Figure 1.
The increase in total strength 1-RM at 3 and 6 months (top graph). Total strength 1-RM represents the contributions from upper body (bench press 1-RM) and lower body (leg press 1-RM). The asterisks at both time points indicate a significant difference (p < 0.05) relative to baseline. The increase in upper body strength 1-RM at 6 months (middle graph). Upper body strength was assessed using the bench press 1-RM. The asterisk indicates a significant difference (p < 0.05) relative to baseline. Lower body strength (bottom graph) was assessed using the leg press 1-RM.