 |
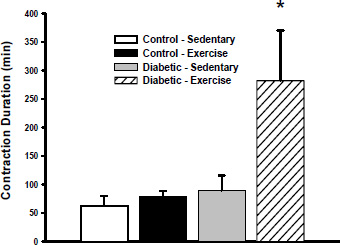
Figure 2.
Contraction duration gastrocnemius – soleus muscle after twitch contractions in the final experiment (mean ± SEM). * Significance compared with the other groups (p < 0.01).
|
|
|
Figure 2.
Contraction duration gastrocnemius – soleus muscle after twitch contractions in the final experiment (mean ± SEM). * Significance compared with the other groups (p < 0.01).
|