 |
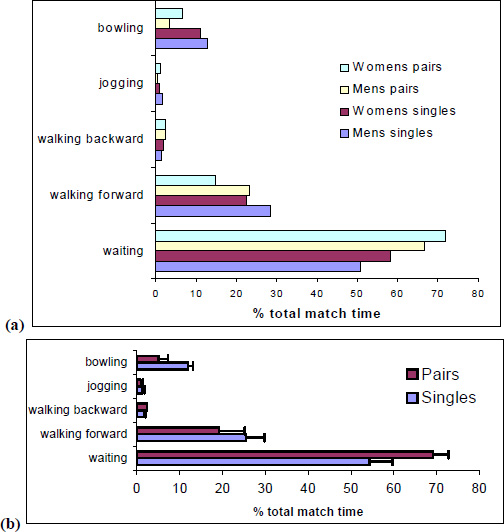
Figure 1.
(a) Percentage of total match time spent within each motion category for each individual match; (b) Percentage of total match time spent within each motion category for combined singles (n = 2) and pairs (n = 2) matches. Displayed as means (±SD).