 |
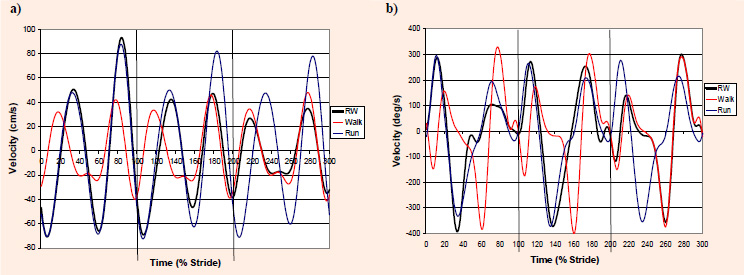
Figure 3.
Comparison of representative graphs of the RWTS-1, RWTS, and RWTS+1 strides, and representative graphs of three constant speed walking and running strides for (a) v and (b) ω. The time of the first stride is represented as 0 to 100%, the second stride as 100% to 200%, and the third stride from 200% to 300%. Vertical lines mark the beginning and end of strides (heelstrikes).