 |
Figure 2.
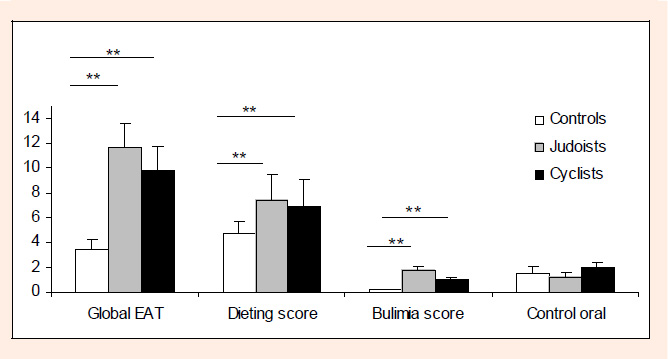
Disordered eating attitudes of the participants. Data are presented as mean ± SD. ** p <0.01 Judoists or Cyclists vs Controls.
|
|
|
Figure 2.
Disordered eating attitudes of the participants. Data are presented as mean ± SD. ** p <0.01 Judoists or Cyclists vs Controls.
|