 |
Figure 1.
Test re-test study: Bland & Altman plot of the difference of the daily energy expenditure estimates between the test-retest periods versus their corresponding mean in the whole sample.
|
|
|
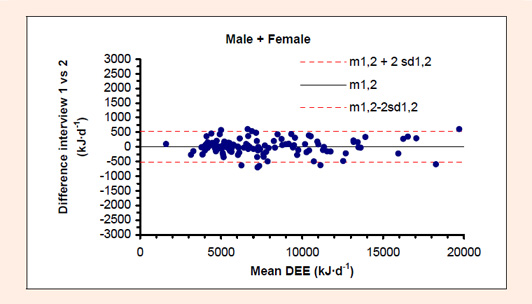
Figure 1.
Test re-test study: Bland & Altman plot of the difference of the daily energy expenditure estimates between the test-retest periods versus their corresponding mean in the whole sample.
|