 |
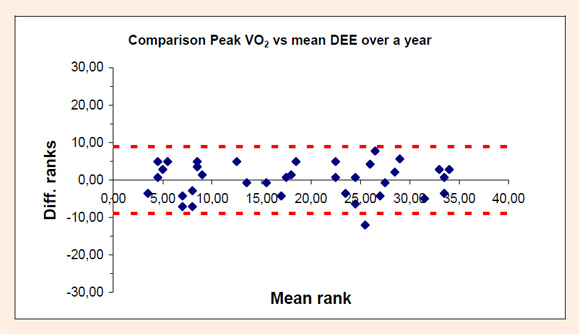
Figure 5.
Bland-Altman plot showing the relationship of the mean daily energy expenditure and peak VO in all subjects based on the respective ranks of the corresponding values of the direct VO and the mean DEE.
|
|
|
Figure 5.
Bland-Altman plot showing the relationship of the mean daily energy expenditure and peak VO in all subjects based on the respective ranks of the corresponding values of the direct VO and the mean DEE.
|