 |
Figure 2.
Comparison of mean endurance times (in seconds) between LBP and controls at given percentages HAT.
|
|
|
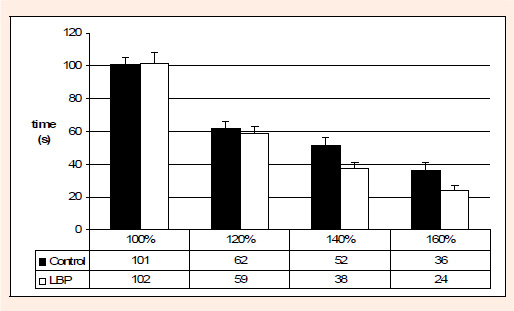
Figure 2.
Comparison of mean endurance times (in seconds) between LBP and controls at given percentages HAT.
|