 |
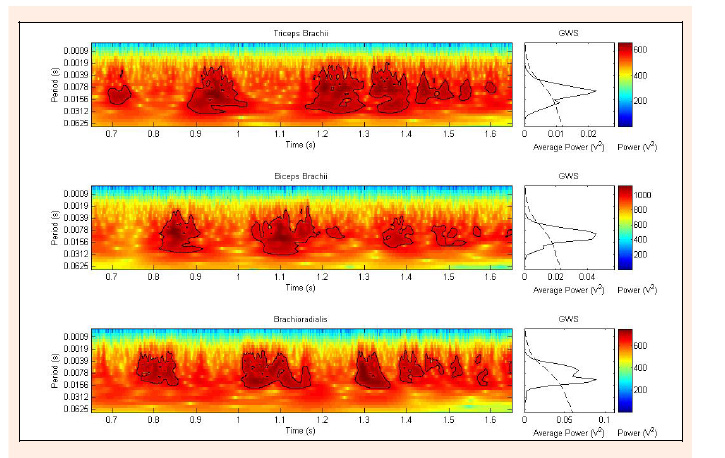
Figure 1.
Wavelet transform power spectrum for the TB, BB and BR for one of the sequence of strikes without impact. A colour scale gives the power (V2) of the periods; intensity increases from dark blue to dark red. The thick contour on the spectra encloses significant regions ( =0.05). Global Wavelet Spectrum (GWS) is the graph of power versus period for the whole duration of the strike analysed. Peaks above the dashed line in the GWS graphs are significant ( = 0.05).