 |
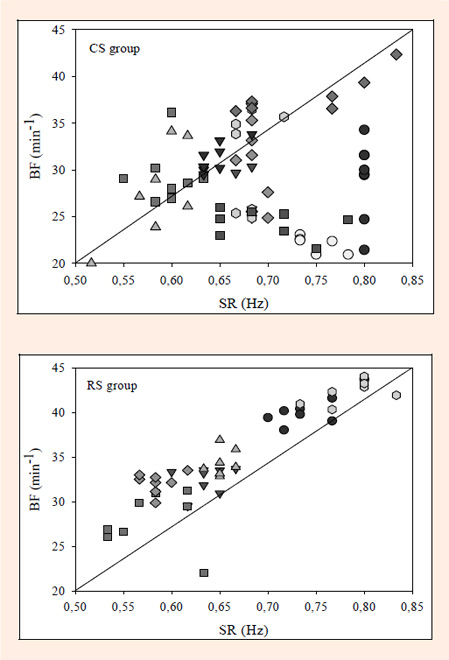
Figure 4.
Individual relationships between BF and SR during the swimming test in the CS group (top) and RS group (bottom, r = 0.89, p ≤ 0.01)). Equal symbols represent the data measured in the same subject at different distances.
|
|
|
Figure 4.
Individual relationships between BF and SR during the swimming test in the CS group (top) and RS group (bottom, r = 0.89, p ≤ 0.01)). Equal symbols represent the data measured in the same subject at different distances.
|