 |
Figure 5.
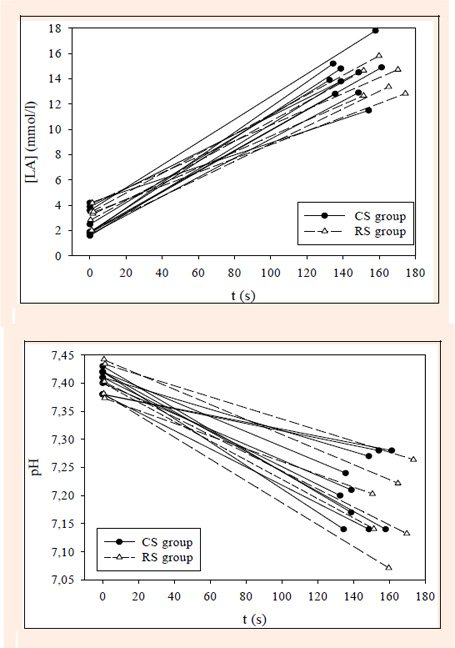
The individual changes of [LA] (top) and pH (bottom) during the swimming test in the CS group (the slopes of solid lines) and in the RS group (the slopes of dashed lines).
|
|
|
Figure 5.
The individual changes of [LA] (top) and pH (bottom) during the swimming test in the CS group (the slopes of solid lines) and in the RS group (the slopes of dashed lines).
|