 |
Figure 2.
Significantly different (p 0.05): * from baseline value; † from before-run value; ‡ from the PLC treatment.
|
|
|
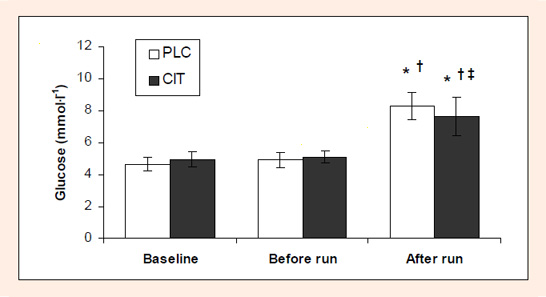
Figure 2.
Significantly different (p 0.05): * from baseline value; † from before-run value; ‡ from the PLC treatment.
|