 |
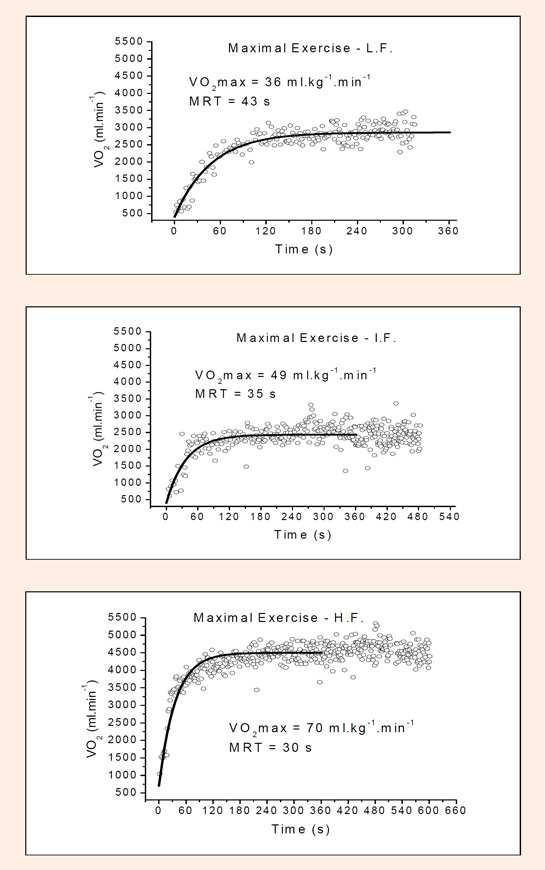
Figure 4.
Representative VO data and the curve fitting of each group at maximal exercise. From up to bottom, respectively low, intermediate and high fitness subjects.
|
|
|
Figure 4.
Representative VO data and the curve fitting of each group at maximal exercise. From up to bottom, respectively low, intermediate and high fitness subjects.
|