 |
Figure 3.
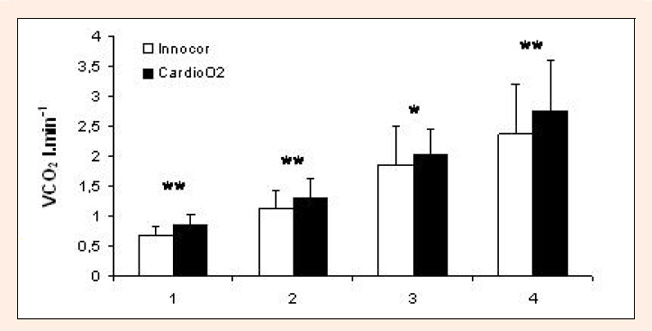
Mean differences in estimated carbon dioxide production (VCO, l.min) between the Innocor and the CardiO through four stages of Bruce protocol. * p < 0.05, ** p < 0.01.
|
|
|
Figure 3.
Mean differences in estimated carbon dioxide production (VCO, l.min) between the Innocor and the CardiO through four stages of Bruce protocol. * p < 0.05, ** p < 0.01.
|