 |
Figure 4.
Bland-Altman plot of individual carbon dioxide production (VCO, l.min) differences between the Innocor and the CardiO metabolic systems. The solid line is at the bias and the dashed lines are at ±95% limits of agreement.
|
|
|
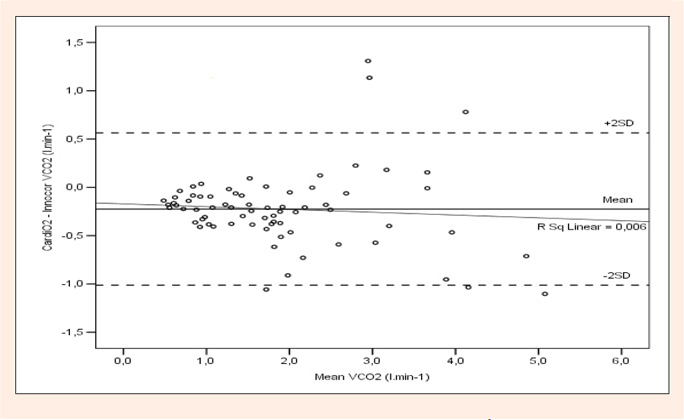
Figure 4.
Bland-Altman plot of individual carbon dioxide production (VCO, l.min) differences between the Innocor and the CardiO metabolic systems. The solid line is at the bias and the dashed lines are at ±95% limits of agreement.
|