 |
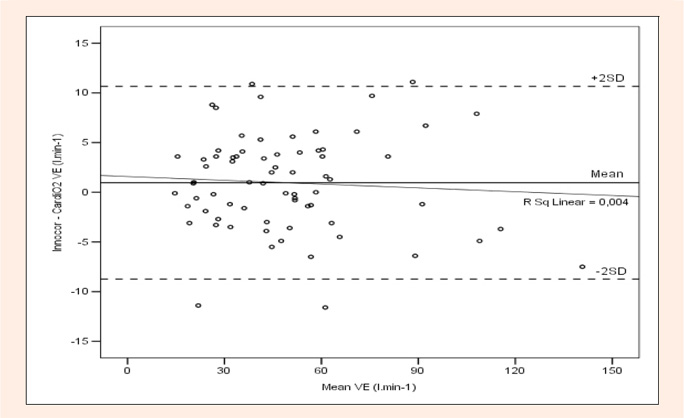
Figure 5.
Bland-Altman plot of individual minute ventilation (V, l.min) differences between the Innocor and the CardiO metabolic systems. The solid line is at the bias and the dashed lines are at ±95% limits of agreement.
|
|
|
Figure 5.
Bland-Altman plot of individual minute ventilation (V, l.min) differences between the Innocor and the CardiO metabolic systems. The solid line is at the bias and the dashed lines are at ±95% limits of agreement.
|