 |
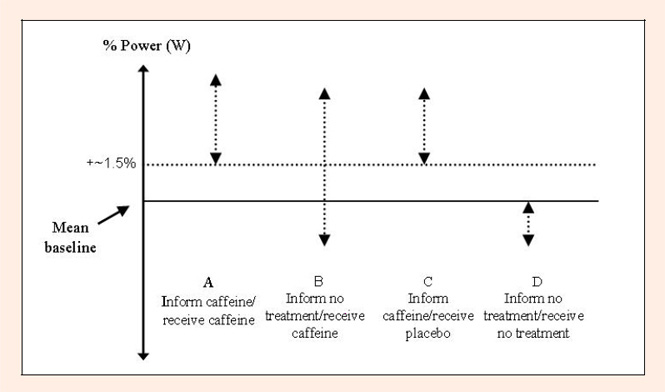
Figure 1.
Hypothesised power output profile for a placebo responsive subject. Note: although vertical lines represent zones for each condition, to be classified as placebo responsive, subjects would be expected to produce greatest power output in condition A, less power in conditions B and C, and less power again in condition D.