 |
Figure 3.
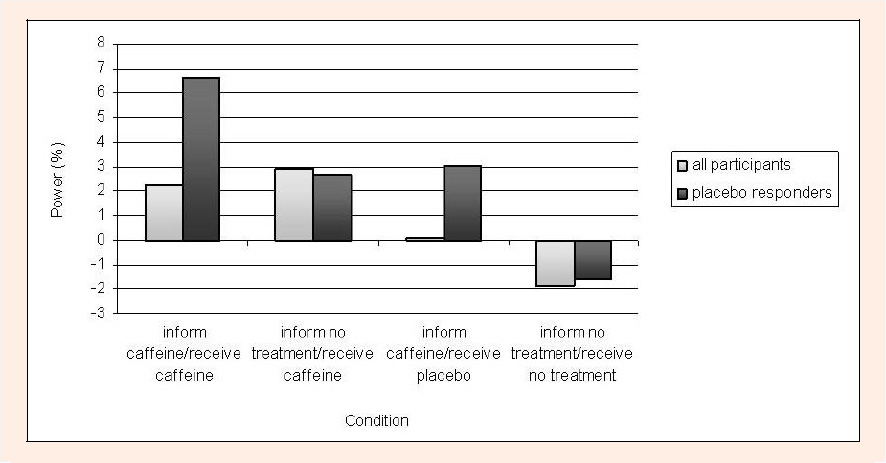
Mean percent differences in power between experimental conditions in all participants (n = 14) and in objective placebo responders (n = 2).
|
|
|
Figure 3.
Mean percent differences in power between experimental conditions in all participants (n = 14) and in objective placebo responders (n = 2).
|