 |
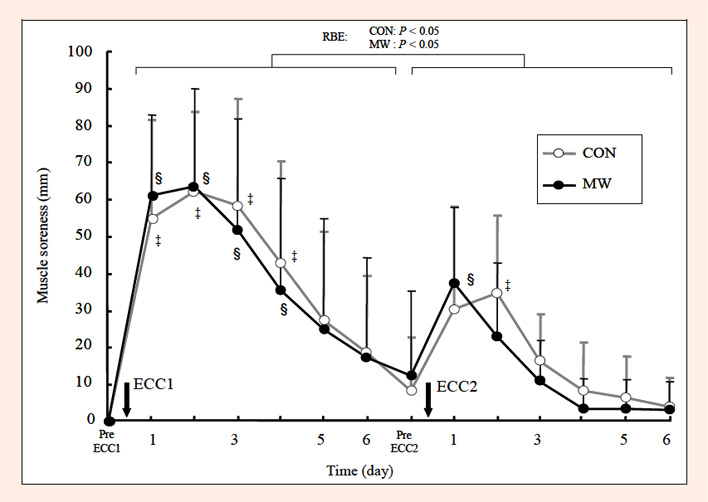
Figure 6.
Measurement of muscle soreness was based on a 100-mm visual analog scale (VAS), with the far-left end point representing no pain (0 mm) and the far-right end point representing extreme pain (100 mm). Open circles denote the CON results. Closed circles denote the MW results. The values are the means ± SD. RBE: repeated bout effect. RBE was analyzed by the Bout × Time interaction for the CON and MW. The p-values for each condition are indicated. ‡ p < 0.05 significantly different from the pre-level in the CON. § p < 0.05 significantly different from the pre-level in the MW.