 |
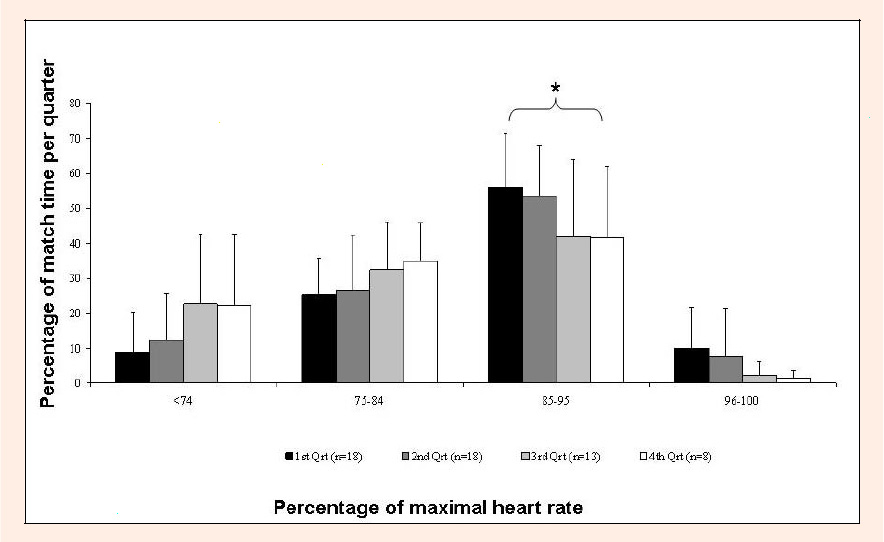
Figure 3.
Mean (±SD) percentage of match time per quarter spent within %HRmax zones across all position categories. Number of athletes measured are indicated next to legend. * indicates significant difference to other HR zone data points for each quarter.