 |
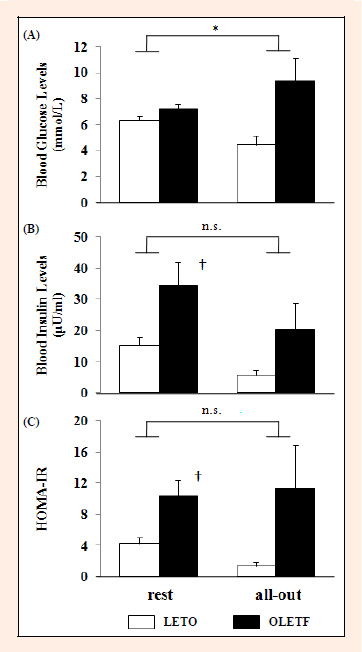
Figure 1.
Change of (A) blood glucose, (B) blood insulin, (C) HOMA-IR levels from rest to immediately after all-out exercise in OLETF (n = 8) and LETO (n=6) rats. Each rat ran with incremental running velocity by every 3 minutes until all-out condition. Immediately after all-out condition, blood samples were collected from fixed catheter of nape and treadmill exercise was stopped. Values represent mean ± SEM. ┼ * significant difference between groups (p < 0.05). † significant difference between resting OLETF vs. resting LETO rats using student’s t-test (p < 0.05).