 |
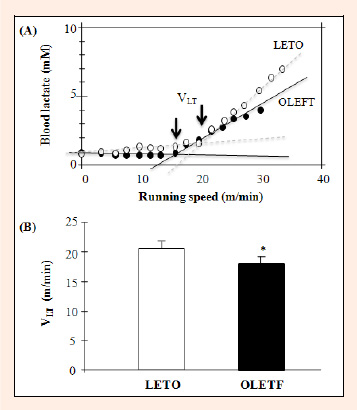
Figure 3.
(A) A representative VLT profile for OLETF and LETO rat is shown during an incremental running velocity protocol. The VLT was determined from the non-linear increase in blood lactate levels vs. running speed using modified regression analysis. Each solid and dotted lines represent the LT velocities of OLETF (No. 2) and LETO rat (No. 11), respectively. (B) Comparison of V LT between OLETF (n = 8) and LETO (n = 6) rats. Values are expressed as mean ± SEM. * p < 0.05.