 |
Figure 4.
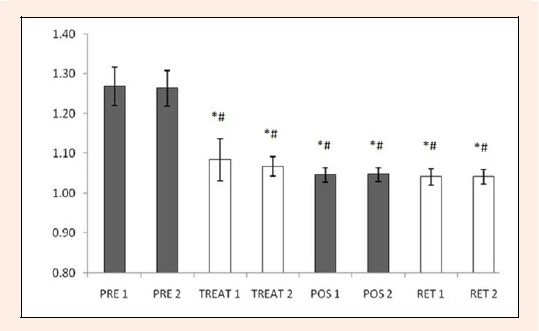
Mean values ± SD of time (ms) to cover 4.5 m in the two PRE, TREAT, POS, and RET sessions. *# Significant differences (p ≤ 0.05) between this session and PRE 1 (*) and PRE 2 (#), respectively.
|
|
|
Figure 4.
Mean values ± SD of time (ms) to cover 4.5 m in the two PRE, TREAT, POS, and RET sessions. *# Significant differences (p ≤ 0.05) between this session and PRE 1 (*) and PRE 2 (#), respectively.
|