 |
Figure 1.
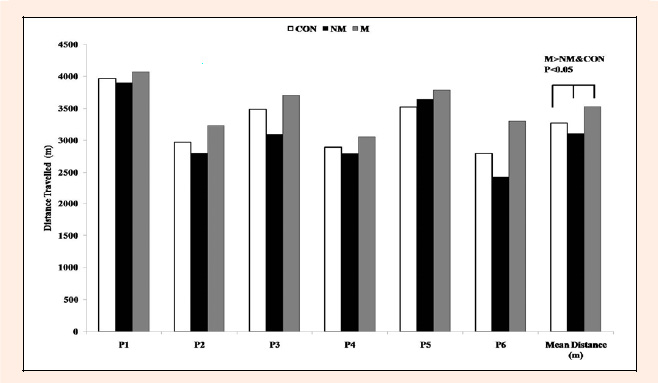
Individual and mean distance covered (m) during each 15 minute maximal effort run in participants 1-6.
|
|
|
Figure 1.
Individual and mean distance covered (m) during each 15 minute maximal effort run in participants 1-6.
|