 |
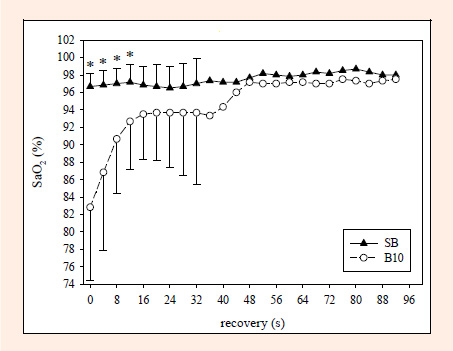
Figure 3.
There were significant differences between SB and B10 in SaO measured at the end of exercise and during recovery (ANOVA for repeated measures, p ≤ 0.01). The statistically analysed results for comparison at defined time during recovery are marked with standard deviations (paired t test). * denote p ≤ 0.05 between the two different breathing conditions.