 |
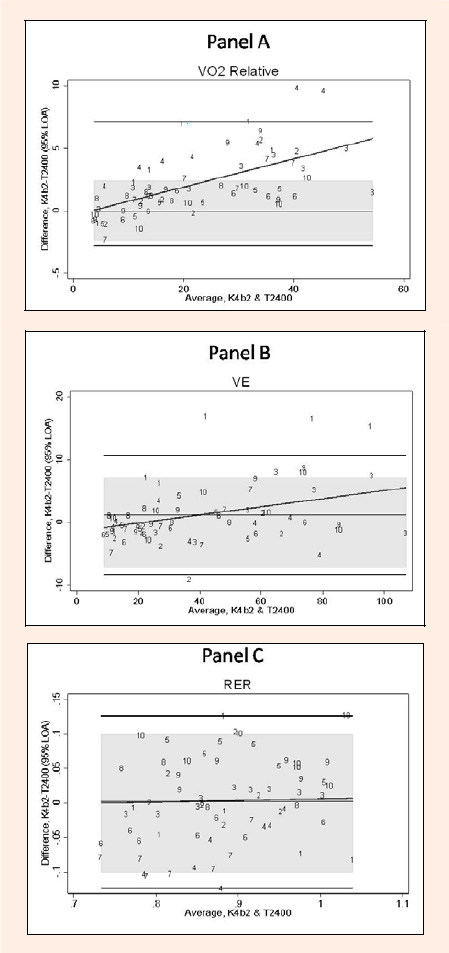
Figure 1.
Repeated observations of VO (Panel A), V (Panel B), and RER (Panel C) measured by the metabolic systems K4band T2400 at different speeds. The plotted upper and lower horizontal lines are the Bland-Altman plots of limits of agreement (LOA). Shaded regions indicate ideal modeled LOA for repeated observations using only the T2400 device.