 |
Figure 5.
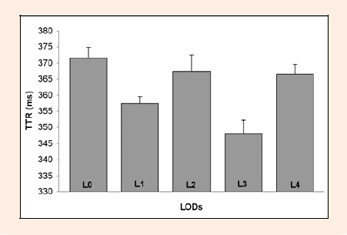
Mean TTR (ms) for all goalkeepers for each of the different LODs. The error bars represent the standard deviations in the mean scores.
|
|
|
Figure 5.
Mean TTR (ms) for all goalkeepers for each of the different LODs. The error bars represent the standard deviations in the mean scores.
|