 |
Figure 6.
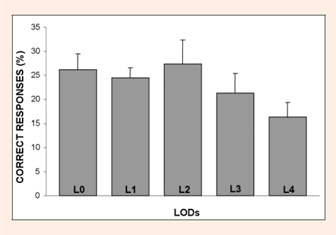
Mean percentage of correct responses for all goalkeepers for each graphical LOD across the two different ball arrival positions. The error bars represent the standard deviations.
|
|
|
Figure 6.
Mean percentage of correct responses for all goalkeepers for each graphical LOD across the two different ball arrival positions. The error bars represent the standard deviations.
|