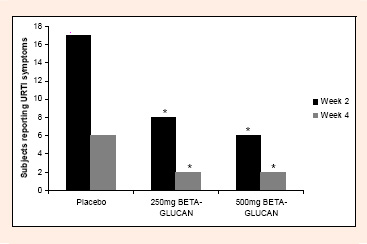
Figure 1.
. Data analysis was by paired t-tests. * ≤ 0.05