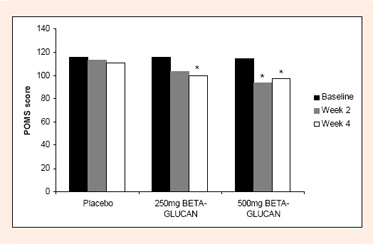
Figure 5.
Data analysis was by paired t-test. *p ≤ 0.05.