 |
Figure 1.
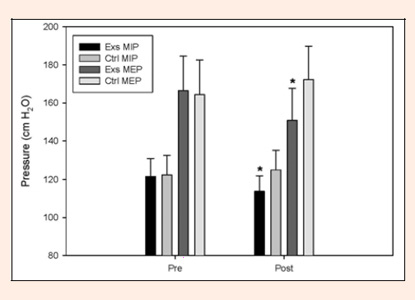
This figure shows pressures elicited during and after the exercise and control studies. Bars are according to legend * = different from Pre value.
|
|
|
Figure 1.
This figure shows pressures elicited during and after the exercise and control studies. Bars are according to legend * = different from Pre value.
|