 |
Figure 3.
Changes in the resting and post-exercise level of 2,3-DPG in the supplemented (S) and control (C) groups.
|
|
|
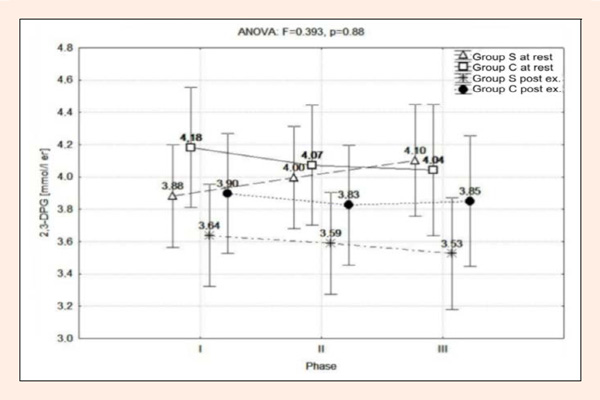
Figure 3.
Changes in the resting and post-exercise level of 2,3-DPG in the supplemented (S) and control (C) groups.
|