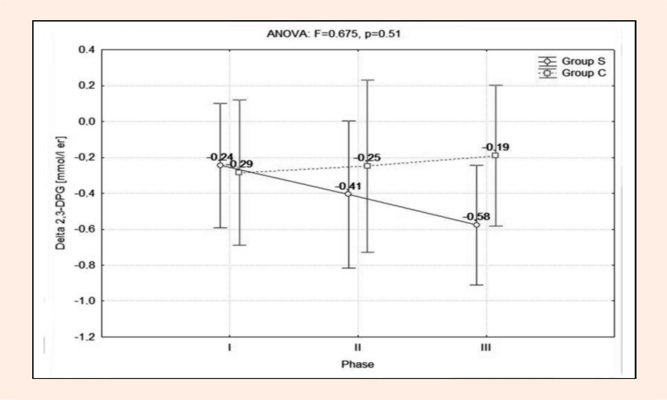
Figure 4.
Changes in values of delta (Δ) 2,3-DPG in the supplemented (S) and control (C) groups.