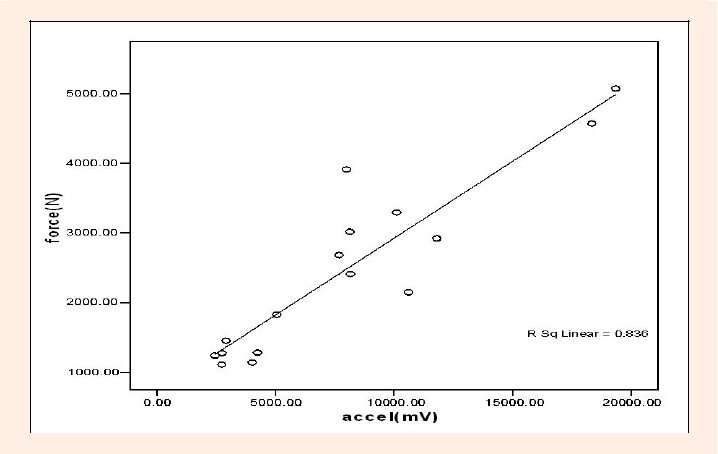
Figure 2.
Plot of calibration data.