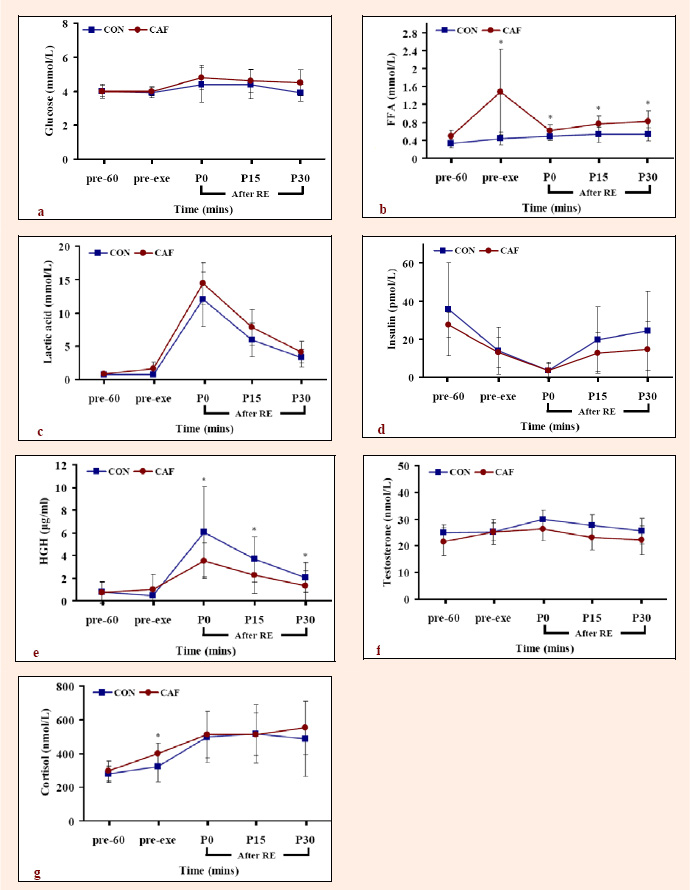
Figure 2.
Values are presented as mean ± standard deviation. * p < 0.05 between CON and CAF.