 |
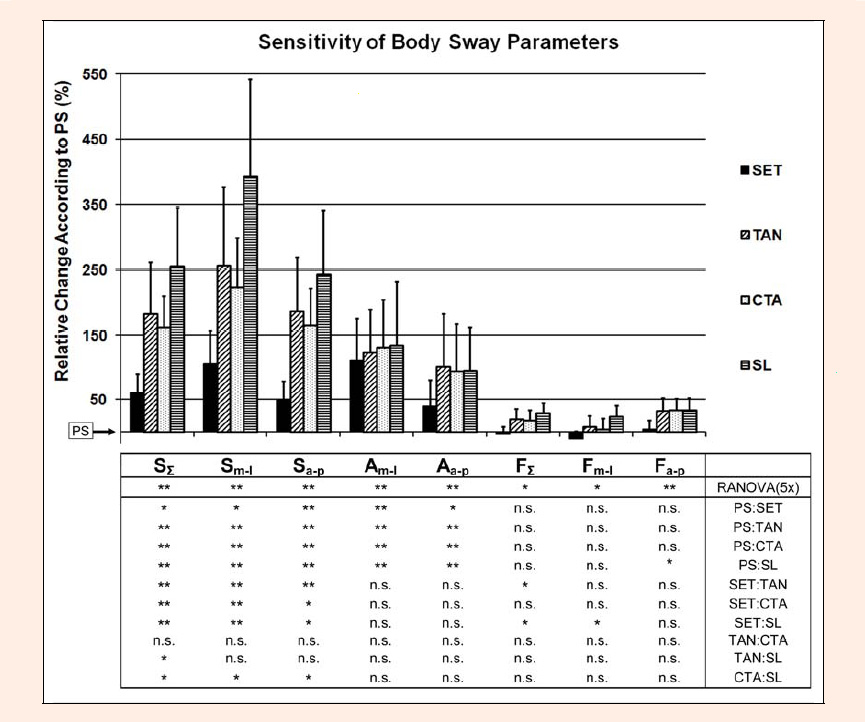
Figure 2.
Vertical bars (average ± standard deviations) represent values of COP parameters relative to the PS values. Statistical significance is indicated (* for p < 0.05, ** for p < 0.01 and n.s. for p ≥ 0.05) in the table below for RANOVA (first row) and T-tests (the lower rows from the second on).